

Quick Summary of Epigenetic Age & Telomere Age Test Results

To see all results in one place, check out this post.
Background
Slow My Age is an account of my journey to achieve the lowest biological age possible, while not significantly infringing on my quality of life. In my introductory post, I explain how I arrived here. For this post, I’ll focus on my most recent biological age results. In my next post, I cover other biomarkers, some of which are also associated with biological age. In subsequent posts, I’ll cover how I was able to slow my aging and reverse my biological age, from my daily routine, to interventions, to self-experiments.
A couple of points to note before we get started:
First, it’s important to look at these results holistically. That is, it’s overly simplistic to focus on a single clock or biomarker to point out its flaws or depend on it too heavily. There’s no single definitive biological age test at this time.
Based on that same logic, it’s probably not appropriate to compare only one or two of my results to someone else’s, while ignoring the others.
Either would be missing the big picture. It’s important to look at all of the biomarkers together to see the story that they tell and to compensate for any individual test’s shortcomings.
Second, with that context in mind, there will be others who outdo my results. At least, I hope there will be, or all of us in the longevity space have failed as a collective at making people aware of how to take control of their aging. The purpose of this site is to awaken people to what’s possible, to inform them on science-backed ways to successfully execute, and to motivate them to achieve a younger biological age. And for the most capable, competitive amongst us, to outdo my results!
Third, these results were computed and reported by the leading third party epigenetic lab, which is used by well-known longevity scientists, MDs and hobbyists alike. My involvement started and ended with me sending in my blood sample and receiving the emailed reports, which I can provide if requested. A member of the lab did me the courtesy of reviewing the numbers and statements in this post to confirm that they are all accurate. Note that NOVOS has since partnered with the lab.
With that out of the way, let’s dig in.
Chronological Age
At the time of this blood-based assessment, I was 37.2 years, chronologically.
Here is an unflattering, awkwardly close selfie for tracking purposes (facial skeleton bone structure, adipose tissue, collagen, skin uniformity & texture, skin wrinkling, etc.), taken a few weeks after the blood draw.

Accuracy & Validity of Results
Note that most of my results are outliers — so much so that I questioned their validity. So, I reached out to the lab (a world authority on biological age clocks) for their perspective. An executive there initially responded, “I am so sorry for this issue. I can say with certainty that this is incorrect” while referring to my results.
However, the next day he followed up:
“The good news is that you are aging incredibly well and that these newest results are absolutely accurate. Seeing your telomere score, I thought that this had to be wrong, but upon second analyses, everything is correct upon a double and triple check.”
He went on to say, “Quite frankly, we haven’t seen a score this good, but it is accurate.“
“Quite frankly, we haven’t seen a score this good, but it is accurate.“
TruDiagnostic Executive
Here is the letter in its entirety.


Now, let’s explore the results!
Telomere Age
Once considered to be perhaps the best indicator of biological aging, telomeres — the end caps of our chromosomes that protect our DNA and get shorter with each cycle of cell division — have disappointed when it comes to accuracy. Nonetheless, telomeres — which are among the known mechanisms of aging — do get shorter with age, can cause other mechanisms of aging (e.g., cellular senescence, DNA damage), and are relevant in the broader context of biological age.
For example, cells have a finite limit to the number of times they can replicate. Once telomeres shorten to a critical point, they will activate a signal to the cell to kill itself or enter a permanent cell cycle arrest (one of the ways that cells can senesce).
As this 2020 paper explains, “Telomere shortening is a well-known hallmark of both cellular senescence and organismal aging. An accelerated rate of telomere attrition is also a common feature of age-related diseases. Therefore, telomere length (TL) has been recognized for a long time as one of the best biomarkers of aging. Recent research findings, however, indicate that TL per se can only allow a rough estimate of aging rate and can hardly be regarded as a clinically important risk marker for age-related pathologies and mortality. Evidence is obtained that other indicators such as certain immune parameters, indices of epigenetic age, etc., could be stronger predictors of the health status and the risk of chronic disease. However, despite these issues and limitations, TL remains to be very informative marker in accessing the biological age when used along with other markers such as indices of homeostatic dysregulation, frailty index, epigenetic clock, etc.”
Females tend to have longer telomeres than males and would therefore tend to be younger according to telomere clocks. To date, I don’t know of any meta-analysis that has been performed for telomere length and mortality, but the association of short telomeres and higher mortality risk has been shown in multiple studies.
Telomere clocks should only be evaluated in the context of other results. Here’s an analogy: if you are looking for signs of cardiovascular risk, you might look at visceral fat, along with blood biomarkers, age, lifestyle, etc. Visceral fat on its own is not adequate to zero in on one’s heart health, but when looked at in the context of other measures, it can contribute to a better risk assessment.
The telomere clock found that my telomere length was 7.8 kilobases, which is an estimated telomere age of 7.8 years (minus 29.4 years from my chronological age). This implies a pace of telomere aging that’s 79% slower than average per chronological year.

“The good news is that you are aging incredibly well and that these newest results are absolutely accurate. Seeing your telomere score, I thought that this had to be wrong, but upon second analyses, everything is correct upon a double and triple check.”
– TruDiagnostic Executive
Some people erroneously believe that long telomeres may increase the risk of cancer, but this is not the case. It’s only when TERT (Telomerase Reverse Transcriptase, a gene that provides instructions for making a component of an enzyme, telomerase, which maintains telomeres) is continuously up-regulated since birth that you may increase the risk of cancer — not by having long telomeres per se, or by up-regulating TERT now and then, as has been shown in multiple recent studies. In fact, short telomeres may lead to a greater risk of certain forms of cancer, especially digestive tumors.
Telomere age: 7.82 years (minus 29.4 years)
Implied rate of aging: 21% (79% slower)
Epigenetic Clocks – A Quick Primer
Epigenetic clocks are tests intended to measure one’s biological age, and are currently considered the most accurate way to do so. A biological age — as opposed to a chronological age — is essentially how old your body, organs and cells actually are according to their ability to properly function. It correlates with your risk for disease, mortality, and your ability to perform physiological functions, which wane as you age.
The foundation for how these clocks’ algorithms function is DNA methylation. Methylation is a process by which genes are (in most instances) repressed, or turned off. An easy way to think about methylation is it functions as an on/off switch, or more accurately, a dimmer for your genes.
Everyone by now knows about genetics, but not everyone realizes that your epigenome, via methylation, is how your genes are expressed. If your genes are the piano keys, your epigenome is the player. And that player is influenced by environmental cues (diet, sleep quality, stress, supplements, exercise, pollution, UV… practically everything!), as well as age.
To that point, as you age, certain genes turn on (often times ones that you don’t want on!) and others turn off (that you don’t want off!). These patterns were closely associated with your chronological age in first and second generation clocks, and now, mortality risk in newer third generation clocks.
Dr. Steve Horvath created the first epigenetic clock in 2011, but more have been created since — many of which I cover in this post.
Immune System Age
The first epigenetic clock we’ll dig into is an extrinsic epigenetic age clock, also known as an immune system age, computed via the Age Hannum EEAA clock. In addition to methylation, this clock also takes into account immune factors, such as lymphocytes, CD4T, CD8T, NK, and neutrophils.
We have two outputs for immune system age, both based on Dr. Gregory Hannum’s extrinsic age clock. So, what’s the difference between each? Data processing can differ across epigenetic outputs. “Old pipeline” indicates data processing in line with the original creation of the clock. “New pipeline” is a newer way to process the data, that is intended to deliver more accurate results.
The “PC” prefix, associated with many of the clocks, stands for Principal Component analysis. PC analysis results in 20x higher power in the calculation than the original versions of the clocks. In other words, these are souped-up, ever more accurate clocks than originally covered in the scientific literature. You can learn more from this paper. (You will see “PC” for many of the results, beyond immune system age.)
So, of the two outputs, the PC Hannum Extrinsic Age utilizing the new pipeline is most accurate. That output is 27.7: minus 9.5 years and 26% slower immune system aging.
Not necessarily related (but perhaps it is), I am fortunate to say that to date, I have either not been infected with COVID, or if I have, I’ve been asymptomatic. I’ve lived in Florida’s “no mask” environment since mid-2020 (and in NYC for five months during the initial panic and rapid spread), received two vaccine shots (no booster) in May/June 2021 with no side effects, and traveled internationally for business for more than a month in January 2022. I also spent days in a confined space with my girlfriend, who was suffering from a bad case of omicron, more than a year after I was vaccinated. I never exhibited any symptoms, and an at-home test came back negative.
Immune systems are influenced by various factors besides age and genetics (diet, specific nutrients, sleep, exercise intensity and recovery, etc.). If I had to bet on the largest factor that has resulted in a significant upgrade to my immune system, it would be supplements. Why? A few reasons.
First, I used to get sick (cold or flu) at least once per year, typically twice, since childhood. Ever since I’ve become disciplined with supplements that can favorably impact the immune system, I haven’t gotten sick — despite COVID — going on four years now.
Second, I used to have very strong allergies, to the point that there would be a week or so in spring where I could hardly get any work done. I also couldn’t be around cats or dogs with dander since I was a child. I spent four years receiving monthly immunotherapy shots, but the improvements were modest and variable. What wasn’t variable was the impact of specific supplements, especially vitamin A.
I now live with one of the hairiest dogs of all, Mia (a rough collie), and have zero signs of allergy. I’m happy to go more in-depth about the immune system nutrients I’ve experimented with in a future post if enough people request it.
PC Hannum EEAA “immune system clock,” new pipeline: 27.7 years (minus 9.5 years)
Implied rate of aging: 74% (26% slower aging)
Biological Age Methylation / Epigenetic Clocks
Seven intrinsic epigenetic clock algorithms were applied to my blood-based methylation, with a range of outcomes (eight, if you count PhenoAge’s PC & non-PC runs). Intrinsic epigenetic clocks aim to measure biological age, as opposed to the previously mentioned extrinsic clock that focuses on the immune system.
The clock that typically overestimates biological age (i.e., offers the least optimistic score, which is typically greater than one’s chronological age) is the PC GrimAge clock. My outcome equated to 41, or plus 3.8 years. However, this number is misleading.
Since PC GrimAge scores tend to be greater than chronological age, it’s best to look at percentile outcome relative to others in your age stratum. For that, my result is in the bottom 5th percentile (lower = slower aging), which this paper explains would equate to half the hazard of death: “A person in the top 95th percentile of AgeAccelGrim (=8.3 years) faces a hazard of death that is twice that of the average person in their stratum (whose AgeAccelGrim equals 0). Specifically, fast aging status is associated with a hazard ratio of HR=2.2=1.108.3. Conversely, a slow ager in the bottom 5th percentile (-7.5 years) faces a hazard of death that is half that of the average person in their stratum, HR=0.49=1.10-7.5.”
Anecdotally, a perfectly healthy, fit 31 year old shared with me that his PC GrimAge outcome was over 50, for whatever that’s worth.
GrimAge is a somewhat newer, second generation clock, and although the age output shouldn’t be looked at literally, the disease and mortality risk is strongly predictive (hence the name!).
The most optimistic intrinsic epigenetic outcome was the PC PhenoAge clock, which pegged me at a stunningly low 7.6 years, or minus 29.6 years. This is certainly an outlier.
Dr. Morgan Levine’s clock is called “PhenoAge” because it takes into account one’s blood phenotype (observable characteristics / outcomes of an individual based on interaction of environment with genes). That is, not only methylation but also biomarkers from the liver (albumin, alkaline phosphatase), kidney (creatinine), metabolism (glucose), inflammation (C-reactive protein), immune system (lymphocyte %, mean cell volume, red cell distribution width, white blood cell count), and chronological age to output a biological (phenotypic) age. The clock uses mortality data as a validator, specifically all-cause, aging-related, cardiovascular disease, cancer, Alzheimer’s, diabetes, and chronic lower respiratory diseases.
As for the other clocks,
PC TruAge = TruDiagnostic’s updated version of the Horvath clock
PCHorvath1 = Principal component version of Horvath 2013
PCHorvath2 = Principal component version of Horvath Skin and Blood Clock
IEAA stands for Intrinsic Epigenetic Age Acceleration
EEAA stands for Extrinsic Epigenetic Age Acceleration (covered in the previous section)
DunedinPoAm45 is the same as DunedinPACE. 45 stands for 45 years of age cohort follow-up data.
Here’s a summary of all outputs:

Average Biological Age Across 10 Epigenetic Clocks:
23.7 (minus 13.5 years)
Implied Lifelong Rate of Aging: 64% (36% slower aging)
–
Average of 6 Principal Component Epigenetic Clocks
25.1 (minus 12.1 years)
Implied Lifelong Rate of Aging: 67% (33% slower aging)
TruAge Intrinsic Age
Are all epigenetic clocks created equal? No. Some have higher degrees of accuracy than others, based on mathematical approaches, data sets (size, range/variability of inputs, etc.), and other factors. Of all the epigenetic clocks, GrimAge and TruAge are currently among best. I will go into more depth about the TruAge clock in a future post.
According to TruAge’s most recent algorithm, my biological age is 23.6, which is 13.6 years less than my chronological age and implies a lifelong pace of aging that is 37% slower than average.
“My biological age is 23.6, which is 13.6 years less than my chronological age”

TruAge Biological Age: 23.6 (minus 13.6 years)
Implied Lifelong Rate of Aging: 63% (37% slower aging)
Pace of Aging Clock–The Best Longevity Tool Of All?
Perhaps the most reliable and valuable of all epigenetic/methylation clocks currently available is the DunedinPACE clock (formerly known as DunedinPoAm), a collaborative effort between Columbia University and Duke University researchers. This clock does not provide a biological age output, but rather, a pace of aging at the time your blood is collected. Industry experts claim that this is the most sensitive of the clocks, with changes that can be seen in as little as three months following an intervention.
This type of clock is particularly relevant because it can tell us about our lifestyles and how they impact our aging at any point in time. Biological age clocks do not change as quickly (which makes sense: it’s harder to reverse decades of accumulated damage than it is to change the speed of aging via lifestyle interventions). Also, biological age tests are currently better suited for population analysis than individual. DunedinPACE, however, is well suited for an individual and can be thought of as aging’s equivalent to a scale during weight loss.
The DunedinPACE clock is based on longitudinal data from the New Zealand Dunedin Study, where subjects in the 1972–1973 birth cohort have been tracked for decades. 1,000 individuals were followed to measure the decline in 19 indicators of organ-system integrity. 95% of the cohort has remained in the study since it launched. To my knowledge, no other clock to date has had access to so much data, for so long, all from a single cohort.
“You also performed insanely well on DunedinPACE.”
– Industry expert
Results from a 2022 study conclude, “DunedinPACE showed high test-retest reliability, was associated with morbidity, disability, and mortality, and indicated faster aging in young adults with childhood adversity. DunedinPACE effect-sizes were similar to GrimAge Clock effect-sizes. In analysis of incident morbidity, disability, and mortality, DunedinPACE added incremental prediction beyond GrimAge.”
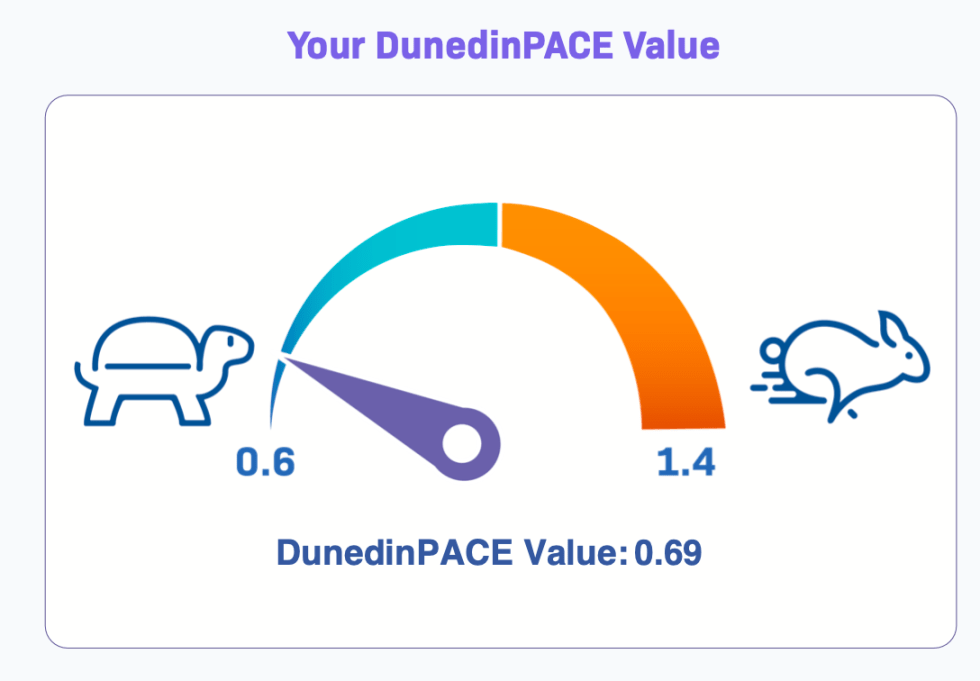

DunedInPACE rate of aging: 69%
What Does This All Mean?
Biological age and its rate of change are currently the best indicators science has for overall health and aging. One reason biological age is relevant is mortality risk. For example, if I’m biologically 37 (my chronological age when tested) rather than biologically 24 (my PC TruAge result), I have a 64% greater chance of mortality. This risk further increases with age. For example, maintaining the same 14-year spread, if I were biologically 100 rather than 86, my risk of death increases by 329%! The same concept applies to risks of age-related chronic illnesses. This is why biological age is relevant.
Even so, ultimately, what do all of these results I shared actually mean? Clearly, I’m not a 7-year-old as my telomeres would imply! And why is there any variance across the tests?
First, as noted earlier, telomeres are not the best measures of biological age when looked at in isolation. So, although helpful in the broader context, we shouldn’t turn to them as the source of truth.
Second, it’s important to note that biological age clocks — epigenetic or otherwise — can be applied to an entire organism or specific organs, systems, and tissue. Therefore, it’s possible for one’s organs and systems to have various ages!
In the future, perhaps I’ll run tests on specific organs to see if there’s greater room for improvement in one or two organs over the others. However, it’s important to note that the intrinsic epigenetic tests I’ve run are on my entire organism, and most take into account overall mortality risk, regardless of the cause or impacted organ.
Third, different tests have varying degrees of accuracy, and scores shouldn’t always be looked at as literal biological “age”, but rather as a percentile in relation to a larger population (e.g., GrimAge).
I’ve already mentioned the value that principal component analysis (PC) brings. Also, the first-generation clocks were tuned to a person’s actual chronological age and were based on linear regression. Newer third generation clocks are tuned to mortality risk and go beyond linear regression (e.g., elastic net regression, ridge regression, neural networks). For that reason, although it’s interesting to see the results from many different clocks, and taking the average may tell us something, I focus primarily on the newer clocks and consider DunedinPACE the best clock to check every six to 12 months (a measure of how I’m currently doing with my lifestyle and interventions).
Fourth, it’s worth noting that having results in the top percentiles across not one or two, but all of these tests, is exceptionally rare and underscores that I’m doing something different than the typical healthy person to achieve these results. So, what is it? We’ll explore the possibilities in future posts.
Where to Go From Here?
My results reveal key insights. First, it’s not my genetics. I have multiple sub-optimal genetic single nucleotide polymorphisms (SNPs), including those associated with longevity, health span, and obesity; more on this in future posts. I also had physical trauma at a young age, which can negatively impact aging (seizure and brain tumor radiation resection at age 16). Yet, despite these suboptimal circumstances, my life-long accumulated damage (biological age), current longevity trajectory (pace of aging), and telomere length are all outliers.
This is a case-in-point example of nature versus nurture: you have far more control over your health than your genes would otherwise have you believe (thank you, epigenome!).
In my next post, I’ll share additional health biomarkers that correlate with age and are also outliers that reinforce this post’s results. After we establish that foundation, we can work toward creating an insider’s look into my lifestyle and interventions that have likely contributed to these results.