

Surrogate Physiological Markers of Longevity – Cardiovascular, Visceral Fat, Skin Aging & Facial Aging
Quick Summary of Results

For epigenetic clocks and telomere aging clocks, see my previous post.
To see all results in one place, check out this post.
Epigenetic Clocks vs. Surrogate Longevity Markers
As I previously covered in my post about epigenetic clocks, newer, third generation clocks are currently the gold standard for measuring one’s biological age. Although the DunedinPACE clock is capable of showing changes from an intervention in as little as three months, biological age clocks can require more time to account for changes beyond their standard error rates.
This makes sense: analogously, you can change the velocity of your car in short order, but significantly changing or even reversing the total distance traveled takes much more time.
Epigenetic tests, although affordable for occasional tests, are not practical for daily, weekly or monthly use. They’re also not perfect.
Ideally, we consider additional biomarkers that can be surrogate markers for aging and can also respond to lifestyle interventions like diet, supplements, Rx, activity and recovery. These can be used to further validate the outputs from epigenetic clocks.
To that point, University of Washington longevity researcher Dr. Matt Kaeberlein (well known for his work with mTOR, rapamycin and the Dog Aging Project) noted on a call in which we went over some of my results, that although he has open questions about epigenetic tests, he has more faith in their outputs if further validated by aligned “real world” biomarkers.
This perspective is echoed in scientific literature. An excerpt from a Frontiers in Genetics paper entitled Ranking Biomarkers of Aging by Citation Profiling and Effort Scoring, reads “Biomarkers of aging are suggested to predict future health and survival better than chronological age… Many researchers believe that sets of biomarkers must be considered to predict aging-related outcomes with confidence (Earls et al., 2019; Kudryashova et al., 2020). Multiple markers may complement each other thereby improving the predictive power” (emphasis added).
The Details
Most of the biomarkers covered in this post can be measured on a daily basis for low cost and range from physical activity, to sleep, heart rate variability, pulse wave velocity, VO2 max, visceral fat, and others. Although I briefly refer to blood-based biomarkers in this post, I will mainly reserve those more invasive measures for a separate post.
Many of these results are correlates of biological age, though on an individual basis, are not as strongly correlated or powerful as epigenetic tests. Analyzing the results holistically to determine how closely they are aligned with epigenetic clock results and if there are any conflicting outliers can increase or decrease our confidence in our methylation-based clock results. Not to mention, many of these biomarkers are indicative of our current health, real world abilities and physical age traits, and are therefore of particular relevance (e.g., mitochondrial and physical fitness, cardiovascular capacity, facial structure, skin wrinkling, etc.).
This post explores some of those physiological biomarker results, which will simultaneously provide a few insights into my activity and sleep routines. Subscribe to my newsletter to be notified of future posts in which I’ll dig deeper into my routines (diet, supplements, Rx, activity, sleep, lifestyle, etc.).
Activity
Physical activity and aging is subject to a chicken-egg debate. Being healthier gifts you with a greater capacity to be physically active for longer periods of time with reduced need for recovery; being physically active makes you healthier and leads to improved physical capacity – on-par with younger, less active counterparts – and reduced risk of all-cause mortality.
Ultimately, for most of us, increasing your physical activity, regardless of your age and health status (assuming no dire conditions or limitations), will lead to a better health and longevity outcome.
In fact, studies have found that a combination of moderate and vigorous physical activity can reduce all-cause mortality by more than 35%.
Source: Minimum amount of physical activity for reduced mortality and extended life expectancy: a prospective cohort study, Lancet. https://pubmed.ncbi.nlm.nih.gov/21846575/

I have made a point to keep physically active starting from when I began exercising at 12 years old. As I hit my late twenties, I began to pay closer attention to the research focused on rest and recovery, and incorporated a lot more walking and additional days of rest into my routine.
For the last four years, I’ve tracked my daily activity with the Oura ring, iPhone and for most workouts, the Apple Watch.
The Oura Ring and Apple Health have different ways of computing walking and running distances. Apple is more accurate, in that they only count actual walking and running towards the total. Oura Ring provides a “walking equivalency,” which also considers other forms of movement (cleaning, exercise, etc.) and provides an equivalent output.
For the last 12 months, Apple computes my daily average walking and running distance as 6.8 miles, or one marathon every 3.8 days. For the Oura ring, my 4-year average is 8.5 miles per day.
How do I manage to run a startup and remain so active? I make sure to bookend my days with walks. I also make a point to be productive while walking or running by taking calls, listening to business-relevant podcasts, or thinking through a challenge.


Over the span of four years, I’ve burned an average of 2,944 calories per day, with some months exceeding 3,200 calories per day (not depicted here). In those months, I was likely slightly overextending myself.

Workouts
I typically run twice per week, bicycle once, weight lift twice to three times (down from six days per week throughout my life. Despite this significant reduction I haven’t lost my muscle mass nor most of my strength), and take long walks on rest days.
I’m meeting or exceeding the 100 minute threshold for daily physical activity, highlighted in the aforementioned Lancet study. My 12-month average workout duration is one hour, 34 minutes, which is not inclusive of other physical activity.

My runs typically range from five to seven miles at ~7:30 min/mi pace. When I want to push myself, I do sub-7:00 min/mi pace for five or six miles, or run nine to 11 miles at a slower pace.


I’m probably a little too aggressive on my runs from the standpoint of longevity. Ideally, I would do more heart rate-based training in zone three cardio, rather than constantly spending 35 to 60 minutes in zone four (lactate threshold) or five (anaerobic). I’m making an effort to be more balanced and intentional with my heart rate zones, but speed is hard for me to resist!
Physical (visceral body fat, muscle mass)
Muscle mass is a biomarker of aging. As Wagner et al., 2016 states, “Irrespective of the definition of sarcopenia, the age-related loss of skeletal muscle mass and strength, both low muscle mass and poor muscle function are highly prevalent and important risk factors for disability and mortality in aging. Cross-sectional and prospective studies examining the relationship between regional muscle mass and health outcomes consistently reported that a low skeletal muscle index (skeletal muscle mass/body mass expressed as percentage) is associated with an increased likelihood of functional impairment and disability. // Collectively these studies all continue to point towards the importance of physical measures, including mobility and body composition as important biomarkers of aging.“
I completed the following tests while at a longevity center in Prague, so the printout is in Czech and neither I nor Siri can read much of it. With that said, here are the important parts that I do comprehend:
- Body weight is 80.1 kg/176.4 lbs
- Muscle weight is 41.6 kg/91.52 lbs, 25% above average
- Right arm muscle is 4.5 kg/9.8 lbs, 29.6% above average
- Left arm muscle is equal to right: 4.5 kg/9.8 lbs, 29.5% above average
- Trunk muscle is 32.4 kg/71.3 lbs, 32.4% above average
- Right leg muscle is 10.2 kg/22.4 lbs, 6.2% above average
- Left leg muscle is 10.1 kg/22.2 lbs, 5.3% above average
In terms of practicing what I preach, I could do a better job with my leg muscles. On the one hand, I’m >5% above average, which puts me in a decent starting position. On the other hand, relative to my other muscle regions, it is significantly lower (which are 30% – 32% above average). My preference for going for runs over lifting on “leg day” is what has lead to this outcome.
- Body fat was 7.4 kg/16.3 lbs (30% below average), or 9.2% of total weight, when measured in the winter on a full stomach. Note when I measure on my Withings scale at home while fasted and on an empty stomach, the output is 7.1 – 7.6%
- Most of the body fat (3.8 kg/8.4 lbs) is in my trunk
- My visceral body fat % (fat stored around the organs, including the liver and intestines; the most dangerous places for fat) is at the top (favorable) percentile for my age. It’s also in the top quartile for a 20-year-old
Regarding visceral fat, Tarrantino et al., 2013, states “Several epidemiologic studies have implicated visceral fat as a major risk factor for insulin resistance, type 2 diabetes mellitus, cardiovascular disease, stroke, metabolic syndrome and death. Utilizing novel models of visceral obesity, numerous studies have demonstrated that the relationship between visceral fat and longevity is causal… It is discussed the need of reducing the visceral fat as a potential treatment strategy to prevent or delay age-related diseases and to increase longevity” (emphasis added).

Cardiovascular
Systolic blood pressure is of particular importance for cardiovascular health and potential complications extending to strokes. In 2007, Pinto found that “Isolated systolic hypertension, an elevation in systolic but not diastolic pressure, is the most prevalent type of hypertension in those aged 50 or over, occurring either de novo or as a development after a long period of systolic-diastolic hypertension with or without treatment… the most powerful predictor of risk is increased pulse pressure due to decreased diastolic and increased systolic blood pressure.“
Blood pressure outputs from the Prague clinic (note, my systolic & diastolic levels are typically lower when I test at home [e.g., 105:65, respectively]):
- Systolic: 118 mmHg (optimal)
- Diastolic: 72 mmHg (optimal)
- Mean arterial pressure (MAP): 87 mmHg (optimal)
- Pulse pressure (PP): 46 mmHg (normal)
- Rate pressure product (RPP): 6608 (optimal)
VO2max. A 2018 paper published in the Journal of the American College of Cardiology, titled “Midlife Cardiorespiratory Fitness and the Long-Term Risk of Mortality: 46 Years of Follow-Up,” followed 5,000 middle aged men for 46 years and found that those in the top 5% of VO2max, which measures how much oxygen your body can take in and utilize during exercise, lived nearly five years longer than those on the bottom 5%. Since the study lasted 46 years and followed subjects into their 90’s, although possible, there’s a low chance for reverse causation.

What were the VO2max levels for the studied subjects? For 40 year olds, the levels were ~50. Following the curve’s trajectory to 38 year olds (my age), the levels are ~51.

My VO2 max recently peaked at 55.5, then immediately declined slightly (-2.5%) to 54.1 after introducing a low dose of 500 mg of metformin into my dinnertime routine, as an experiment with my doctor related to slightly elevated fasting blood glucose (I have longevity relevant theories about my blood glucose levels that I can share in a future post if requested). 57 days after the addition of metformin, I’m back above 55, so it seems that metformin’s acute effect on VO2 max may be surmountable.
Note that metformin was NOT taken during epigenetic age tests, telomere age, nor most of the results covered here and is a brand new (< two months) experiment. [Jan 2023 note] I discontinued use of metformin after approximately 3 months and have not used it since.
In the future, I’ll go more in-depth about metformin and its impact on longevity, exercise performance, semen quality, etc. For now, I’ll just acknowledge that I’m aware of all of these considerations.
My VO2 max output is considered above average for a 20 to 25 year old.

Pulse Wave Velocity (PWV) is the gold standard measure for arterial stiffness and cardiovascular aging; low grade inflammation, or “inflammaging” is also implicated in aortic stiffness. Arterial elasticity is fundamental to cardiovascular health, and as such, a favorable outcome from a PWV test is lower velocity.
PWV increases with age. A 2015 study published in the Journal of American College of Cardiology, which compared Ikaria inhabitants (one of 5 places in the world with with the highest rates of longevity) vs. the general population found that not only does PWV increase with age, but also that environmental and lifestyle factors are capable of favorably impacting PWV outcomes starting from age 50.

Scores for 40-49 year olds averaged 7.98 ± 0.96 m/s (Ikaria) and 7.92 ± 0.69 (general population).
My PWV, according to the Withings Body Comp scale, averages ~5.9 m/s, with last month’s minimum hitting 5.7 m/s. I’m working on this as I would like to regularly maintain <=5.7 m/s. (Note, I’ve found certain supplements and diets to have positive effects on my PWV scores; I can cover this in a future post if requested.)
EKG results were (fortunately) nothing to comment on.

Respiratory rate over a four-year span averaged 13.4/min. Recently, that figure has dropped below 13.0/min. I don’t yet know why, but it correlates with improved sleep over that same timespan (I also upgraded to the Oura Ring 3.0 around December, which has improved sensors and could possibly explain why).

Resting heart rate during sleep is between 40 to 41 beats per minute over the span of four years.

Resting heart rate while awake has averaged 48 BPM over the last 12 months.

Total sleep has averaged 8h:08m, over the span of four years. Sleep quality has improved since February (I was traveling in January), and I’ve gotten closer to 8.5 hours. Sleep is extremely important to me (for longevity purposes, overall health, mental and physical performance, lucidity and mood); I’ll do a post devoted to it in the future.

Blood oxygen saturation has stayed above 90%, typically above 95%, for the span of May 2022.

Blood Labs
For the last 8+ years, I have inputted the results of more than 150 biomarkers across my 26 blood labs into a spreadsheet I created. This spreadsheet includes ideal, acceptable, and unacceptable ranges for each blood biomarker, which then conditionally formats the cell as green, yellow or red, respectively.
I have set my own standards for each biomarker by researching and soliciting informed medical perspectives, then modifying the lab’s standard ranges. I always make the ranges more stringent, because labs are too often basing ranges on population averages, not on ideal outputs for maximal health and longevity.
Here’s a high-level look at the spreadsheet:

Over this 8-year span, I’ve tracked diets and overall lifestyle changes. I’ve come to some conclusions (e.g., a long-term, sustained keto diet does not work for me, based on biomarkers and subjective changes; shorter duration keto diets do, but I need to be disciplined with my fat sources) and many insights, which have informed my decisions beyond what research studies are capable of.
If requested, I will dig deeper into aging relevant blood biomarkers, my results and the insights gleaned in a future post.
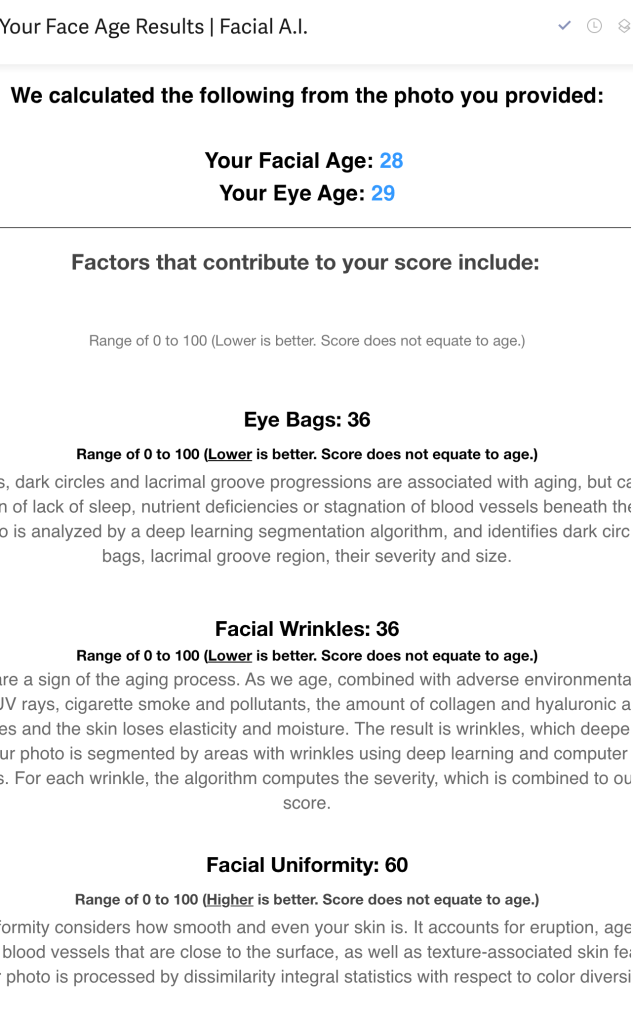
Facial Age
NOVOS has a cool facial AI tool that is trained on a dataset of more than 12 million images and validated by human dermatological experts. It’s free and provides seven outputs after analyzing your selfie:
- Perceived Facial Age
- Perceived Eye Age
- Eye Bag Score
- Facial Wrinkle Score
- Facial Uniformity Score
- Facial Pore Score
- Facial Redness
My facial age score is 28 and eye age is 29. Facial uniformity is a 60 (100 is best), but I expect it would improve if I had shaved (the algorithm at the time of the measurement was not trained for facial hair, eyeglasses, etc.).
In order to get accurate results across tests, you need to make sure you use identical lighting, the same camera and distance/angle, are well-hydrated, don’t have any skincare or makeup on your face, have shaved and have taken off your eyeglasses.
Concluding remarks
Although these are not all of the biometrics I track, it is many of them. And between this post and the previous one, you can get a good idea of my overall health and multiple datapoints reinforcing my biological age being lower than my chronological age.
It’s with these metrics that I track my progress, formulate scientific research-based hypotheses & adjustments (or, experiments), then consider — in the face of data — whether I want the adjustment to be integrated into my routine.
I’ve been taking this approach for much of my adult life, but it has only been in the last decade or so that I’ve become as regimented and disciplined on the data side of my approach.
It is through this process that I have been able to arrive at my current Longevity Routine (future posts) and the greater than one-third reduction in my biological age as originally reported in this post.